C55 · Unit C5 Function analysis and optimization
Reading a derivative graph without a formula
CoreReview editionNot yet human-reviewed
- Time
- About 45 minutes, untimed
- Course framework reference
- AP 5.9
- Part of
Progress on this lesson counts in every pathway listed.
Understand the idea
When the given graph is f minutes, its height tells whether f rises or falls, and its trend tells whether f is concave up or down. Area under f minutes gives change in f only after integration has been learned. A zero of f minutes must be tested for a sign change to classify an extremum. A turning point of f minutes may locate an inflection of f even when f minutes is nonzero.
Worked example
Suppose f minutes is piecewise linear through (0,2),(2, minus 2),(4,0),(6,2). Then f decreases on (1,4), has a local maximum at 1 and minimum at 4. Since f minutes decreases on (0,2) and increases on (2,6), f changes concavity at 2.
Explore the mathematics
Reading a derivative graph without a formula
Read an original function’s behaviour from its derivative graph.
Scroll sideways to see the full diagram.
Predict before continuing
Where is the original function f increasing?
Read the complete explanation
- Where is the original function f increasing?
- f increases where the displayed derivative is positive: x<−1 and x>1.
- It decreases on (−1,1), where its derivative is negative.
- The sign changes imply a local maximum at the left zero and local minimum at the right zero for f. The height of f is not determined without an initial value.
Scroll sideways to view the full diagram.
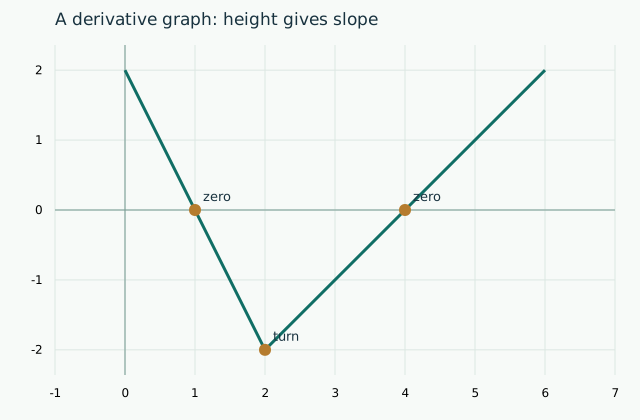
Derivative graph of straight segments through (0,2),(2,−2),(4,0),(6,2).
| x | f′(x) |
|---|---|
| 0 | 2 |
| 2 | −2 |
| 4 | 0 |
| 6 | 2 |
A common misconception
The highest point on the f minutes graph is the greatest slope of f, not necessarily its greatest function value.
Investigate and explain
Sketch two antiderivative graphs compatible with the same derivative plot. Explain what information is shared and what is free.
Identify one step in the worked example, name the mathematical fact that permits it, and state its domain conditions.