C01 · Unit C1 Limits and continuity
Limits: nearby behavior, graphs and tables
CoreReview editionNot yet human-reviewed
- Time
- About 45 minutes, untimed
- Course framework reference
- AP 1.1–1.4
- Part of
Progress on this lesson counts in every pathway listed.
Understand the idea
A limit describes outputs near an input, not necessarily at that input. The finite two-sided limit at a exists exactly when the left and right limits agree. A graph uses approaching branches to show this; a filled point gives the actual function value. Tables can suggest a limit but cannot prove one because finitely many sampled values leave behavior between them undetermined.
Worked example
Let f(x) equals x+2 for x<1, f(1) equals 7 and f(x) equals 4 minus x for x>1. Both side limits at 1 are 3, so lim f(x) equals 3 even though f(1) equals 7. Changing only the filled point does not change the limit.
Explore the mathematics
Limits: nearby behavior, graphs and tables
Approach a missing point from both sides without substituting into an undefined expression.
Scroll sideways to see the full diagram.
Predict before continuing
What value do the outputs approach near x=2?
Read the complete explanation
- What value do the outputs approach near x=2?
- Approach from both sides; the point at x=2 is missing.
- At x=2±0.125, the outputs are 4±0.125.
- The limit is 4 although f(2) is undefined. Defining f(2)=4 repairs this removable discontinuity.
Scroll sideways to view the full diagram.
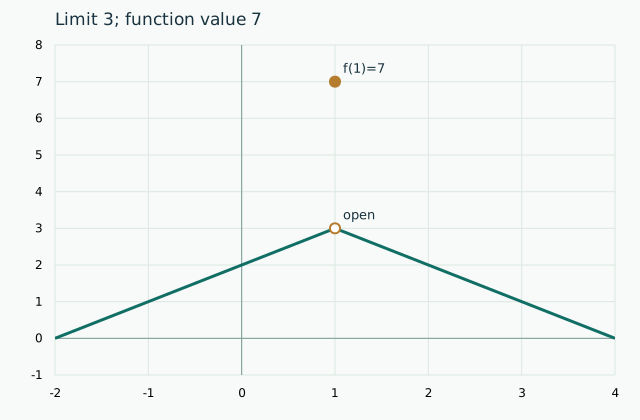
Two line branches meet at the open point (1,3), while the filled value at x=1 is 7.
| Input | Rule or value |
|---|---|
| x<1 | x+2 |
| x=1 | 7 |
| x>1 | 4−x |
A common misconception
An undefined function value does not imply a nonexistent limit. A table with equal-looking values can miss oscillations or a jump.
Investigate and explain
Construct a table near x equals 2 for the described function, then draw its graph with the open and filled points. Explain the information each representation hides.
Identify one step in the worked example, name the mathematical fact that permits it, and state its domain conditions.